Help
General Information
- The use of wild cards in queries is possible:
- "*": matches any string of zero or more characters.
- "_": matches any single character.
- Hyperlinks are marked in blue.
- Hyperlinks to external websites are embedded in "<>".
- Javascript has to be activated to use all functions of the system (without Javascript only basic functions are available).
BLAST
top |↑|
BLAST Query Page
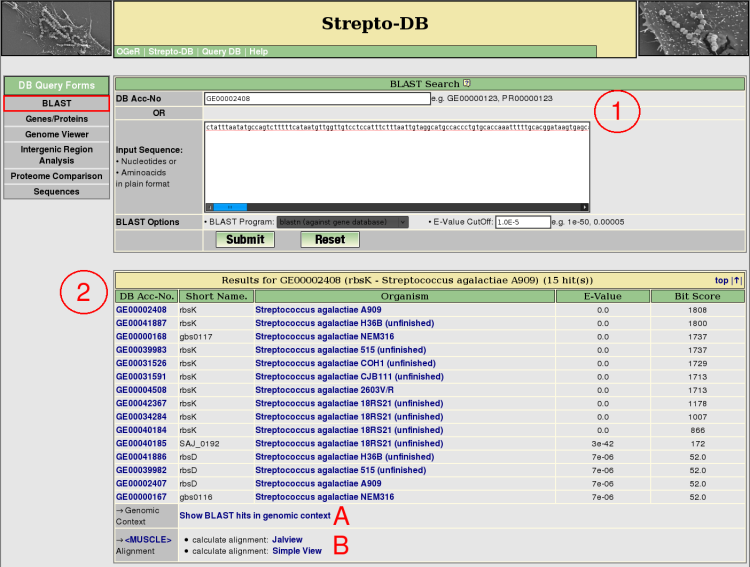
- Insert either a DB accession number or a sequence in plain format, select a BLAST program and set the e-value cutoff for the BLAST analysis. Nucleotide BLAST (blastn) against the gene database or the replicon sequence database and aminoacid BLAST (blastp) against the protein database are provided.
- After the query submission, the BLAST results are listed showing the e-value and the bit score of the BLAST analysis. The genomic context of the BLAST hits can be displayed as shown for the genome map on the gene result page (A). The multiple alignment of the homologous proteins can be calculated using <MUSCLE>.
Genes/Proteins
top |↑|
Genes/Proteins Query Site
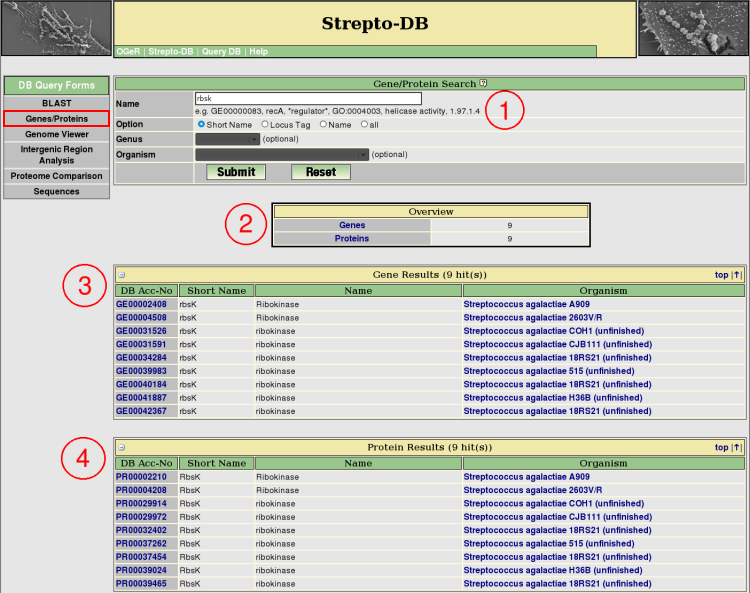
- Insert the query term(s) and select the query options. Restrict the query to the short name, locus tag or gene/protein name entry to reduce the query time.
- After the query submission, an overview table provides links to the gene and protein result tables, showing the number of hits.
- The gene results are listed below the overview table. Detailed information about each gene is provided via the hyperlink on the DB accession number.
- The protein results are listed below the gene result table. The hyperlink on the DB accession number provide detailed information about each each protein.
Gene Result Page
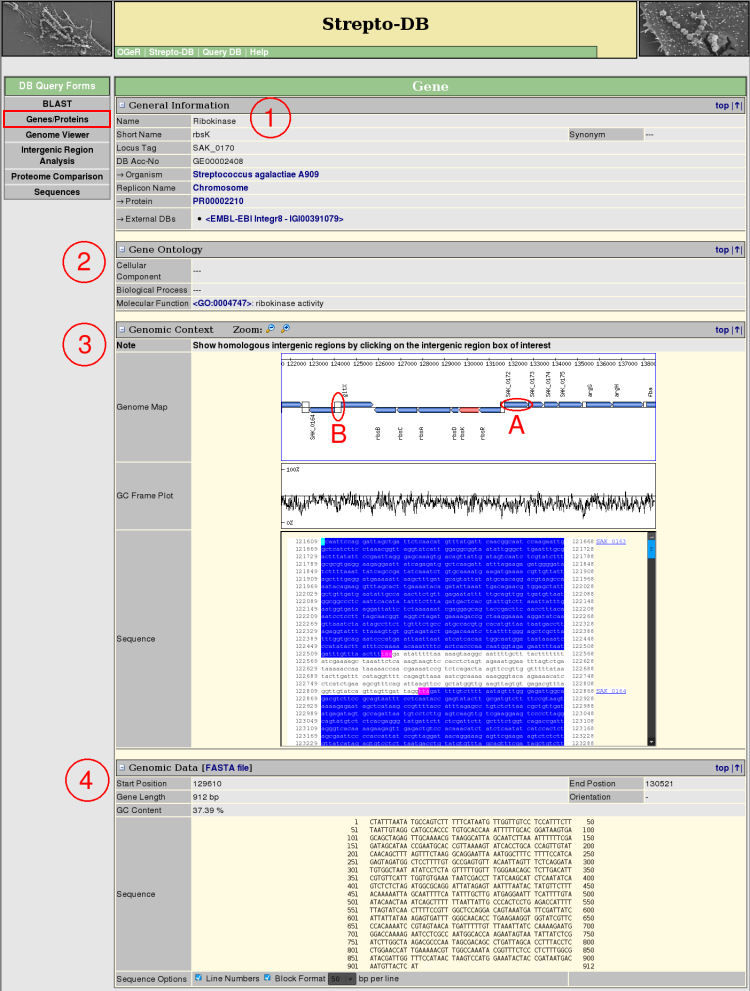
- General Information about the gene and the referring organism is given. Hyperlinks to other internal and external websites provide further information.
- The Gene Ontology terms are shown, if annotated, linking to the corresponding entries in <AmiGO>.
- The Genomic Context view provides a zoomable map of the gene and its adjacencies complemented by a GC frame plot and the DNA sequence. The gene boxes in the genome map link to the corresponding genes (A) whereas the intergenic regions (B) link to the intergenic region analysis page.
- The Genomic Data section gives information about the gene sequence properties. The sequence format can be varied, whereas the FASTA format is provided for download.
Protein Result Page
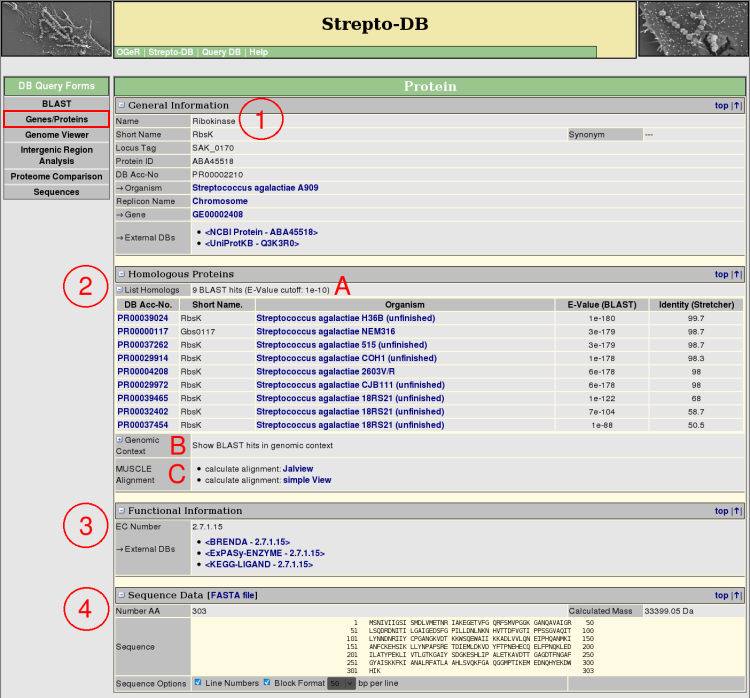
- General Information about the protein and the referring organism is given. Hyperlinks to other internal and external websites provide further information.
- The homologous proteins from the internal BLAST database are listed, showing the BLAST e-value and the % sequence identity calculated by a pairwise alignment with stretcher from the <EMBOSS package> (A). The genomic context of the BLAST results can be displayed as shown for the genome map on the gene result page (B). The multiple alignment of the homologous proteins can be calculated using <MUSCLE>.
- If annotated, functional information like EC numbers with links to external databases or signal peptides are displayed.
- The Sequence Data section gives information about the protein sequence properties. The sequence format can be varied, whereas the FASTA format is provided for download.
Genome Viewer
top |↑|
Genome Viewer - Organism Selection
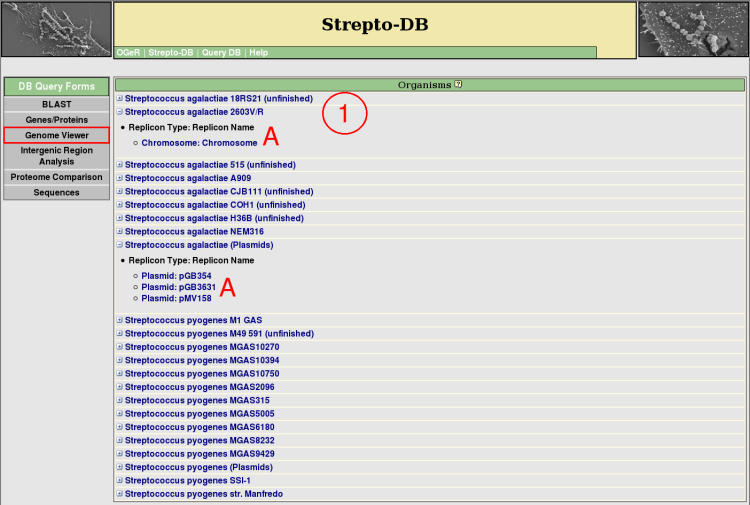
- All organisms included in the database are listed and their replicons/contigs can be shown (A). Detailed information about each organism or replicon/contig is provided via the hyperlink on the organism or replicon/contig name.
Genome Viewer
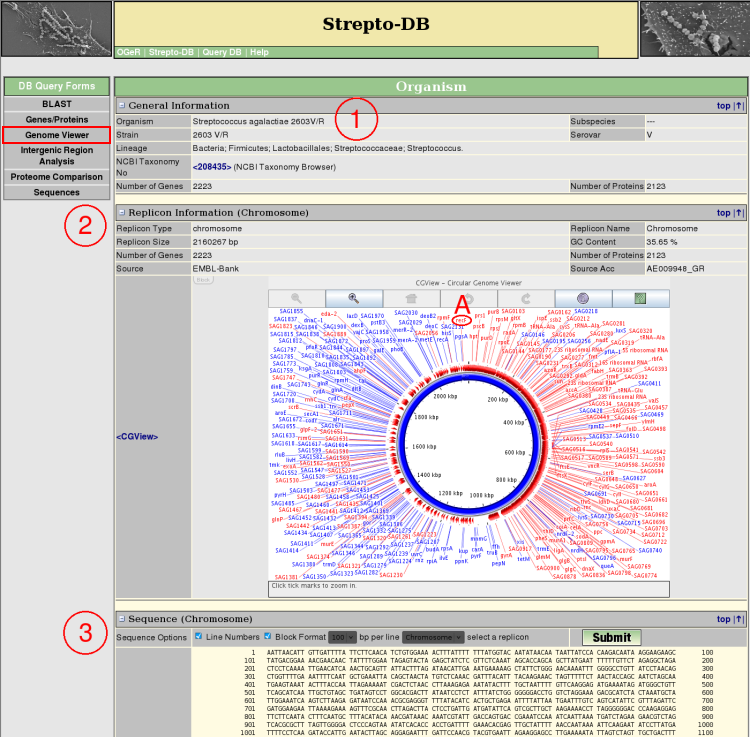
- General Information about the organism is given.
- Each replicon sequence can be displayed and formatted in different ways.
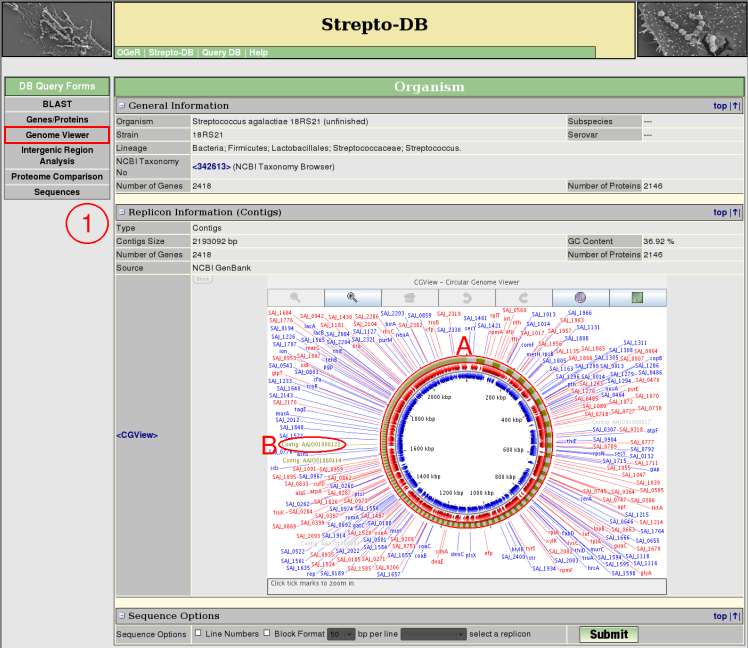
Genome Viewer - Contigs
Intergenic Region Analysis
top |↑|
Intergenic Region Search
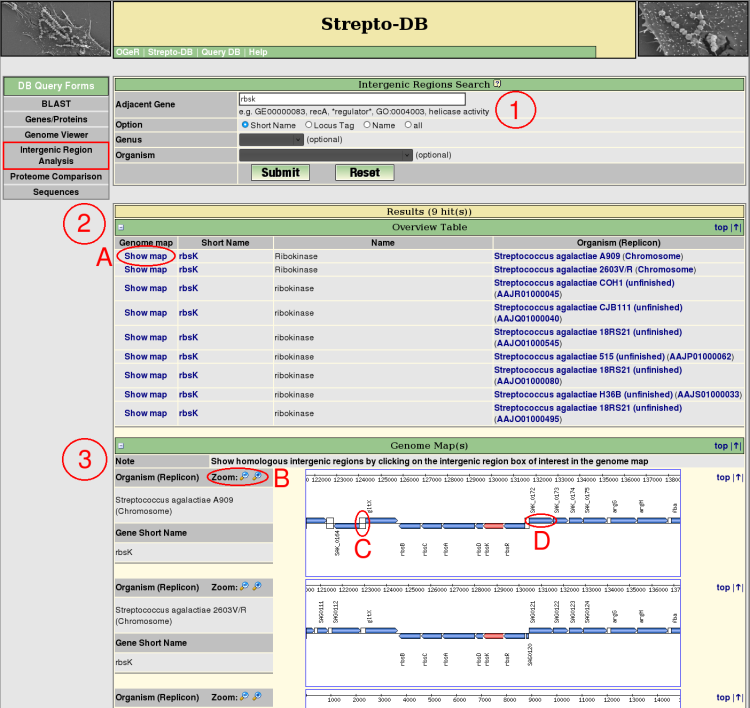
- Insert the query term(s) for the gene flanking the intergenic region of interest and select the query options. Restrict the query to the short name, locus tag or gene name entry to reduce the query time.
- After the query submission, an overview table provides information and links to the genome map (A) for each resulting intergenic region.
- Each resulting gene and its ajacencies are shown in a zoomable (B) genome map. The intergenic region analysis can be started using the link of the intergenic region of interest (C). The gene boxes provide links for further information of the corresponding genes (D).
Intergenic Region Analysis
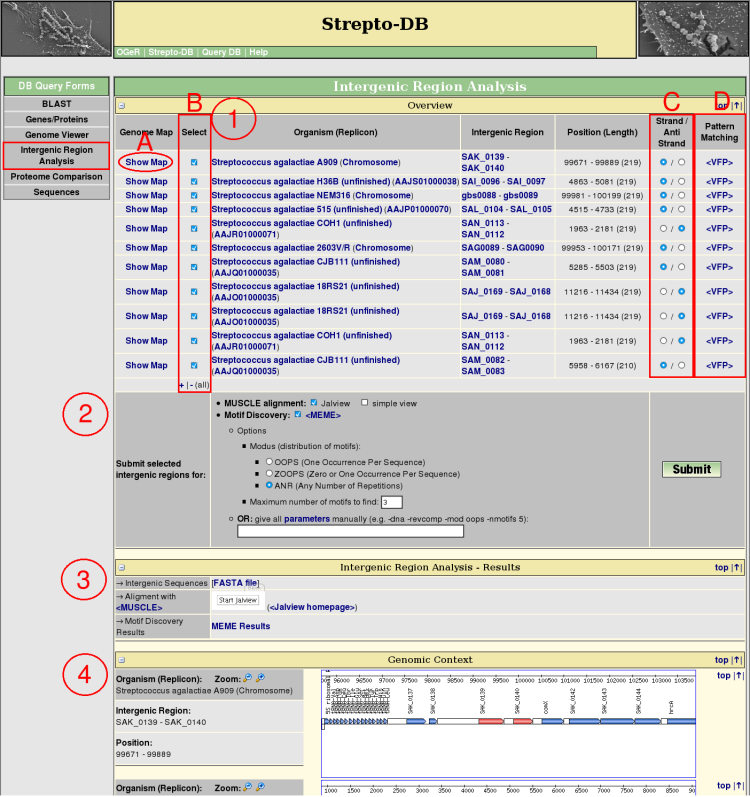
- The orthologous intergenic regions are searched via a BLAST analysis of both flanking genes of the intergenic region of interest. The resulting regions are listed in an overview table providing links to the corresponding genome map (A), the flanking genes, genomic position and length of the intergenic regions. These results include integenic regions with BLAST hits of both flanking genes of the query as well as those which are flanked only by one of the homologous genes. The red-colored genes in the genomic context view (4) represent these BLAST hits.
Each of the intergenic regions can be analysed with the pattern matching program <Virtual Footprint> (D) which uses the Position Weight Matrices (PWMs) of the <PRODORIC database>.
For further analysis the intergenic regions of interest can be selected (B) and their sequences can be changed to the reverse complement (C). The preselection of the sequence orientation is set to the orientation of the query region referring to its flanking genes. If unsure (e.g. a intergenic region between a + and a - orientated gene was selected) the preselction is set to the +-strand.
- Select analysis methods (multiple alignment, motif discovery). For motif discovery via <MEME> some basic analysis parameters are given for selection. Alternatively the parameters can be entered manually. An overview of all parameters can be displayed via a hyperlink.
- After the query submission, the results of the selected analysis methods are displayed complemented by the FASTA file of the intergenic regions.
- The genomic context of the selected intergenic regions is shown. The genes representing a BLAST hit referring to the query are marked in red.
Proteome Comparison
top |↑|
Proteome Comparsion Selection
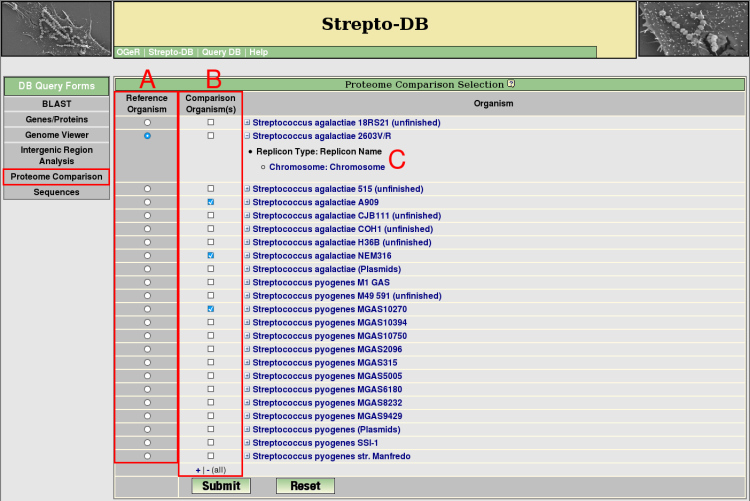
- For proteome analysis a reference organism (A) and at least one organism for the comparison has to be selected (B). The organism list can be extended to see the included replicons/contigs (C). The proteome comparison analysis performs a blastp search of all proteins from the reference organism against the proteins of the selected comparison organisms. For a reverse BLAST hit with a maximum e-value of 1e-5, the corresponding proteins are regarded as homologs.
Proteome Comparsion Results
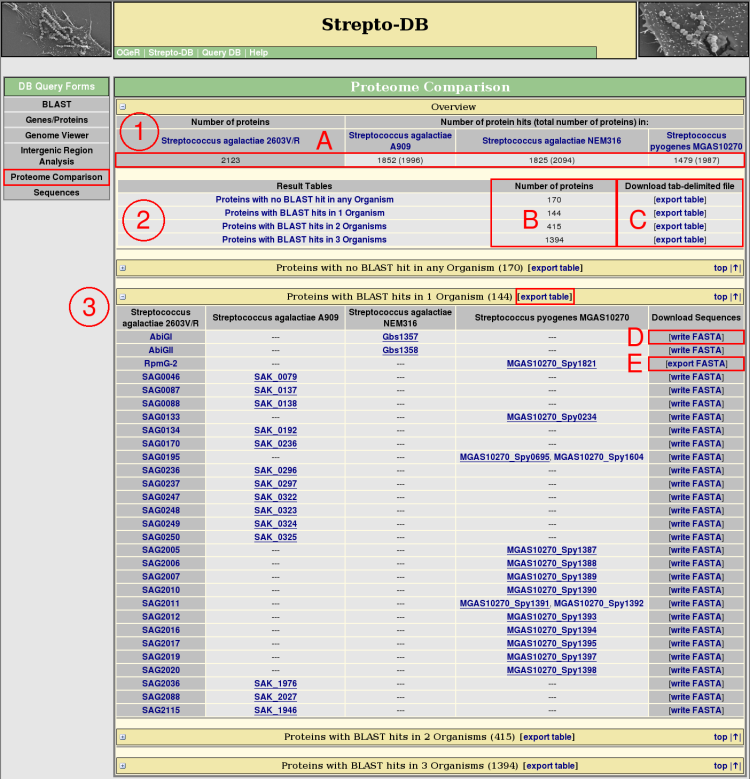
- An overview table shows all selected organisms, presenting how many proteins of the reference organism can be found in each of the comparison organisms by BLAST (A). In addition, the total number of proteins is given in brackets.
- The proteins from the reference organism are splitted into groups corresponding to their occurence as BLAST hits within the comparison proteomes. That means, all proteins with no BLAST hit in any comparison organism are in one group, proteins with only one BLAST hit in another group, and so on. The number of proteins from the reference organism are given for each of these result tables (B).
- For each group, a table is provided that lists the protein names and the names of the homologs from the referring reference organisms. These tables can be downloaded as tab-delimited files (C). The best hit of a comparison organism considering the e-value of the BLAST search and the % sequence identity of the global alignment by stretcher ( <EMBOSS package>) is underlined. The FASTA file of each row of homologous proteins can be written (D) and afterwards downloaded (E).
Sequences
top |↑|
Sequence Search by Position
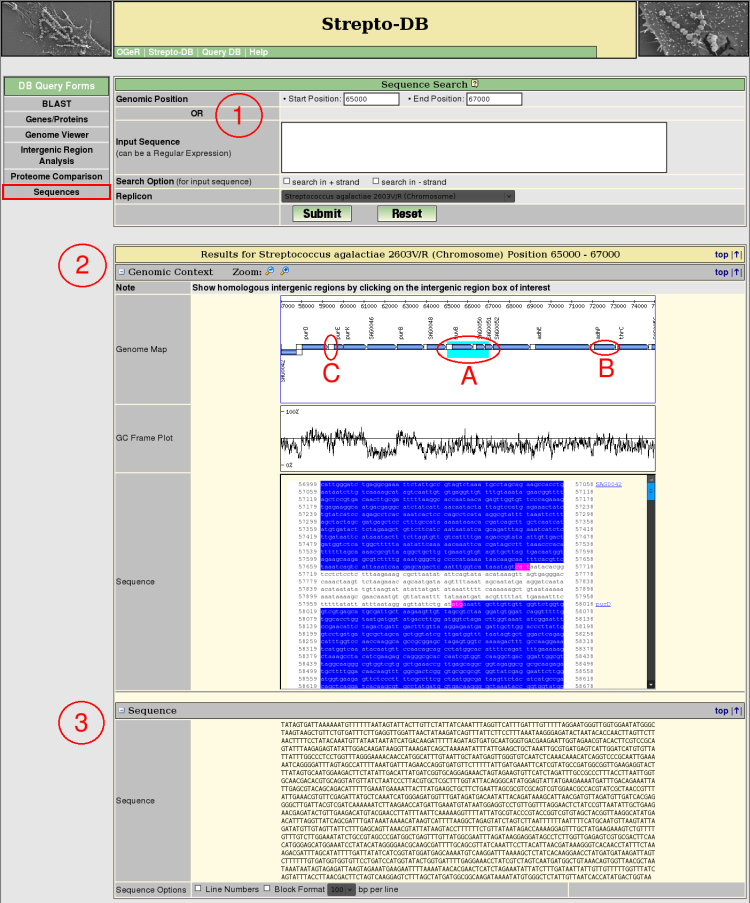
- Insert the start and stop position and select the replicon/contig of interest. If the the start position is higher than the stop position the reverse complement of the sequence will be given in table (3).
- The Genomic Context view provides a zoomable map of the sequence and its adjacencies complemented by a GC frame plot and the DNA sequence. The resulting sequence is colored (A). The gene boxes in the genome map link to the corresponding genes (B) whereas the intergenic regions (C) link to the intergenic region analysis page.
- The result sequence is given and can be formatted in different ways.
Sequence Search by Sequence
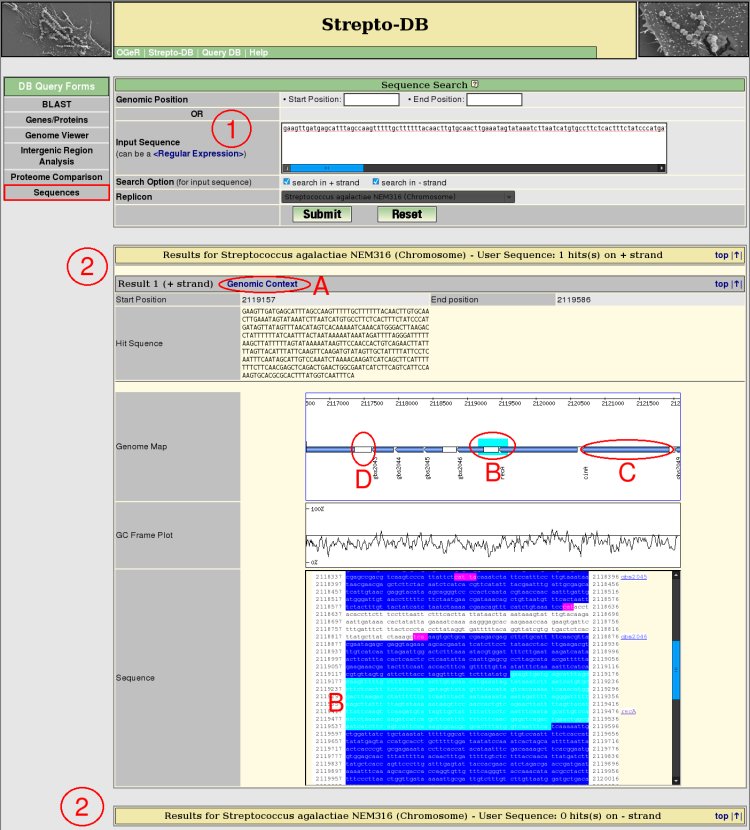
- Insert the search sequence and select the replicon/contig of interest and the strand(s) which should be searched in. The search sequence can be a regular expression.
- After the query submission, all resulting hits are listed whereas the hits are arranged by the referring strand of the DNA. Each hit shows the corresponding genomic position and the sequence itself. The genomic context of each resultig sequence can be displayed (A). The genome map shows the marked sequence and provide links to the gene information pages (B) and the intergenic region analysis (C).